hdmax2 application for univariate exposome
Florence Pittion, Magali Richard, Olivier Francois
January, 2024
hdmax2_univariate.RmdIntroduction
When a statistical association is observed between an external exposure (\(X\)) and an individual outcome (\(Y\)), one or more intermediate variables ({}) (such as gene expression or epigenetic changes) may mediate this effect. Identifying and assessing the mediating role of these variables in the effect of \(X\) on \(Y\) is crucial for deciphering underlying causal mechanisms in epidemiological and clinical research.
The R package hdmax2 is dedicated to high-dimensional
mediation analyses. For mediation analyses, the necessary data includes
one (or more) exposure variable(s), a matrix of potential mediators, and
an outcome variable.
The term “high dimensional” refers to the large quantity of potential mediators among which we seek to identify the actual mediators.
The fundamental concept behind HDMAX2 methods is to use a latent factor mixed regression model for estimating unobserved latent factors while conducting high-dimensional association analysis.
The package hdmax2 is designed to accept
Exposure \(X\) consisting of univariate data, which can be continuous, binary or categorial as well as multivariate exposure.
Outcome \(Y\) can be continuous or binary
Potential mediators \(M\) must be continuous.
In this vignette, we treat the univariate exposure example.
To install the latest version of hdmax2, use the github
repository
#devtools::install_github("bcm-uga/hdmax2")Simulated dataset
We simulated data for 100 samples and 500 potential mediators.
For this example we use a binary exposure, a continuous outcome and two adjustment factors (age and gender). The matrix of potential mediators is an extract of real methylation data (TCGA PDAC samples).
We define the \(K\) number of estimated latent factors by performing a PCA on potential mediators matrix. The scree plot criterion looks for the “elbow” in the curve and selects all components just before the line flattens out, \(K\) is chosen with this procedure.
simu_data = hdmax2::simu_data

## High dimension mediators
M = simu_data$M1

## Exposures
X  = simu_data$X_binary

## Outcomes
Y  = simu_data$Y_continuous

## Covariates
age = simu_data$age
gender = simu_data$gender
covar = cbind(age, gender)
covar = as.data.frame(covar)
## Number of Latent factore estimation
pc <- prcomp(M)
plot((pc$sdev^2/sum(pc$sdev^2))[1:10],
     type = "b",
     xlab = 'Principal Component',
     ylab = "Explained variance")
K=4 #pca conclusion : it is better to select too many factors that too fewBinary exposure and continuous outcome
STEP 1: Run association studies
The run_AS function is applied:
First to estimate latent factors with \(lfmm\) algorithms.
Then to identify significant effects of exposure \(X\) on potential mediators in \(M\) matrix, and significant effect of potential mediators on outcome \(Y\).
And eventually to compute mediation test: max-squared test.
The run_AS function takes as inputs:
- \(X\) for exposure: can be a vector, a factor with \(n\) (samples) elements or a data frame with \(n\) rows and 1 column.
- \(Y\) for outcome: can be a vector or a matrix with \(n\) rows and 1 column.
- \(M\) for the potential mediators: must be a matrix with \(n\) rows and \(p\) columns (potential mediators).
- \(K\) for the number of latent factors defined earlier: must be integer.
- Adjustment factors covar can be included: must be numeric (data frame or matrix) with \(n\) rows.
Here \(n\)=100 and \(p\)=500
hdmax2_step1 = hdmax2::run_AS(X = X,
                              Y = Y,
                              M = M,
                              K = K,
                              covar = covar)
The run_AS function provides an object containing:
Results from the two association studies (\(P\)-values, fscores, zscores),
Latent factors estimation matrix \(U\) (\(p\) rows and \(K\) columns) from first regression,
run_ASfunction’s inputs,And max-squared test \(P\)-values results.
Selection of a subset of mediators
max-squared \(P\)-values are used in the selection of mediators for the user’s chosen method.
Numerous selection methods are available, such as FDR control. Also in the context of methylation data, it’s feasible to aggregate methylation probes. Refer to the helper_functions vignette for assistance FDR control and AMR researching procedure.
In this instance, we opted for the top ten most significant \(P\)-values from the max-squared test as an example.
## Selecting top 10 mediators
## top 10 selecting mediators

mediators_top10 = M[,names(sort(hdmax2_step1$max2_pvalues)[1:10])]
head(mediators_top10)
#>            cg00022633 cg00019093 cg00025981 cg00031759 cg00035636 cg00049102
#> GSM1051525   1.480526   1.091212  0.8611761   1.096765   1.498758   2.029784
#> GSM1051526   5.463677   3.474162  3.7370006   3.996897   1.481787   2.000932
#> GSM1051527   5.334700   3.369454  3.6640206   3.889718   1.439573   1.891203
#> GSM1051528   5.225207   3.289293  3.6175162   3.808743   1.443054   1.816579
#> GSM1051529   1.691596   1.260262  0.9876545   1.249065   1.603649   2.217188
#> GSM1051530   6.307245   4.088710  4.2104976   4.571531   2.310486   2.725880
#>            cg00028749 cg00049616 cg00026603 cg00703120
#> GSM1051525  0.7984107   1.767392   1.840380  0.8521711
#> GSM1051526  3.9441627   1.743678   3.914640  0.8315540
#> GSM1051527  3.8633605   1.667866   3.856255  0.8473967
#> GSM1051528  3.8147481   1.599476   3.748134  0.8744509
#> GSM1051529  0.9114222   1.886485   1.997508  0.8602605
#> GSM1051530  4.3556358   2.324293   4.553996  0.8814345
STEP 2
The function estimate_effect estimate the individual
indirect effect of mediators, but also overall effects of selected
mediators.
The function estimate_effect takes as inputs, step 1
object and selected mediators matrix \(M^S\) from chosen selection method apply on
max-squared test \(P\)-values.
The function estimate_effect use
mediation::mediate function to obtain several effects
estimation with uncertainty:
ACME Average Causal Mediation Effect: corresponding to the indirect effect
PM Proportion Mediate: corresponding to the proportion of the total effect that is mediated by the mediator
TE total effect: which is equal to the sum of direct and indirect effect
ADE Average Direct Effect: which represents the unmediated effect.
This step also compute Overall effects :
OIE (Indirect effect): corresponding to the sum of the indirect effect associated with all mediators.
ODE (Direct Effect): corresponding to the effect of exposure variables on the outcome variable.
OTE (Total Effect): corresponding to the effect of exposure variables on the outcome variable when the mediators \(M^S\) are included in the model.
In addition, function estimate_effect estimates the
intermediary effect sizes \(a_j\) and
\(b_j\) and their standard
deviations.
hdmax2_step2 = hdmax2::estimate_effect(object = hdmax2_step1,
                                       m = mediators_top10)
Vizualisation of results
We propose a set of plots including:
Mediators ACME Forest plot
Mediators PM Forest plot
Comparison of ODE, OIE and OTE
Mediators effect size representation
library(ggplot2)
hdmax2::plot_hdmax2(hdmax2_step2, plot_type = "all_plot")
#> [1] "hdmax2 plot for univariate exposome"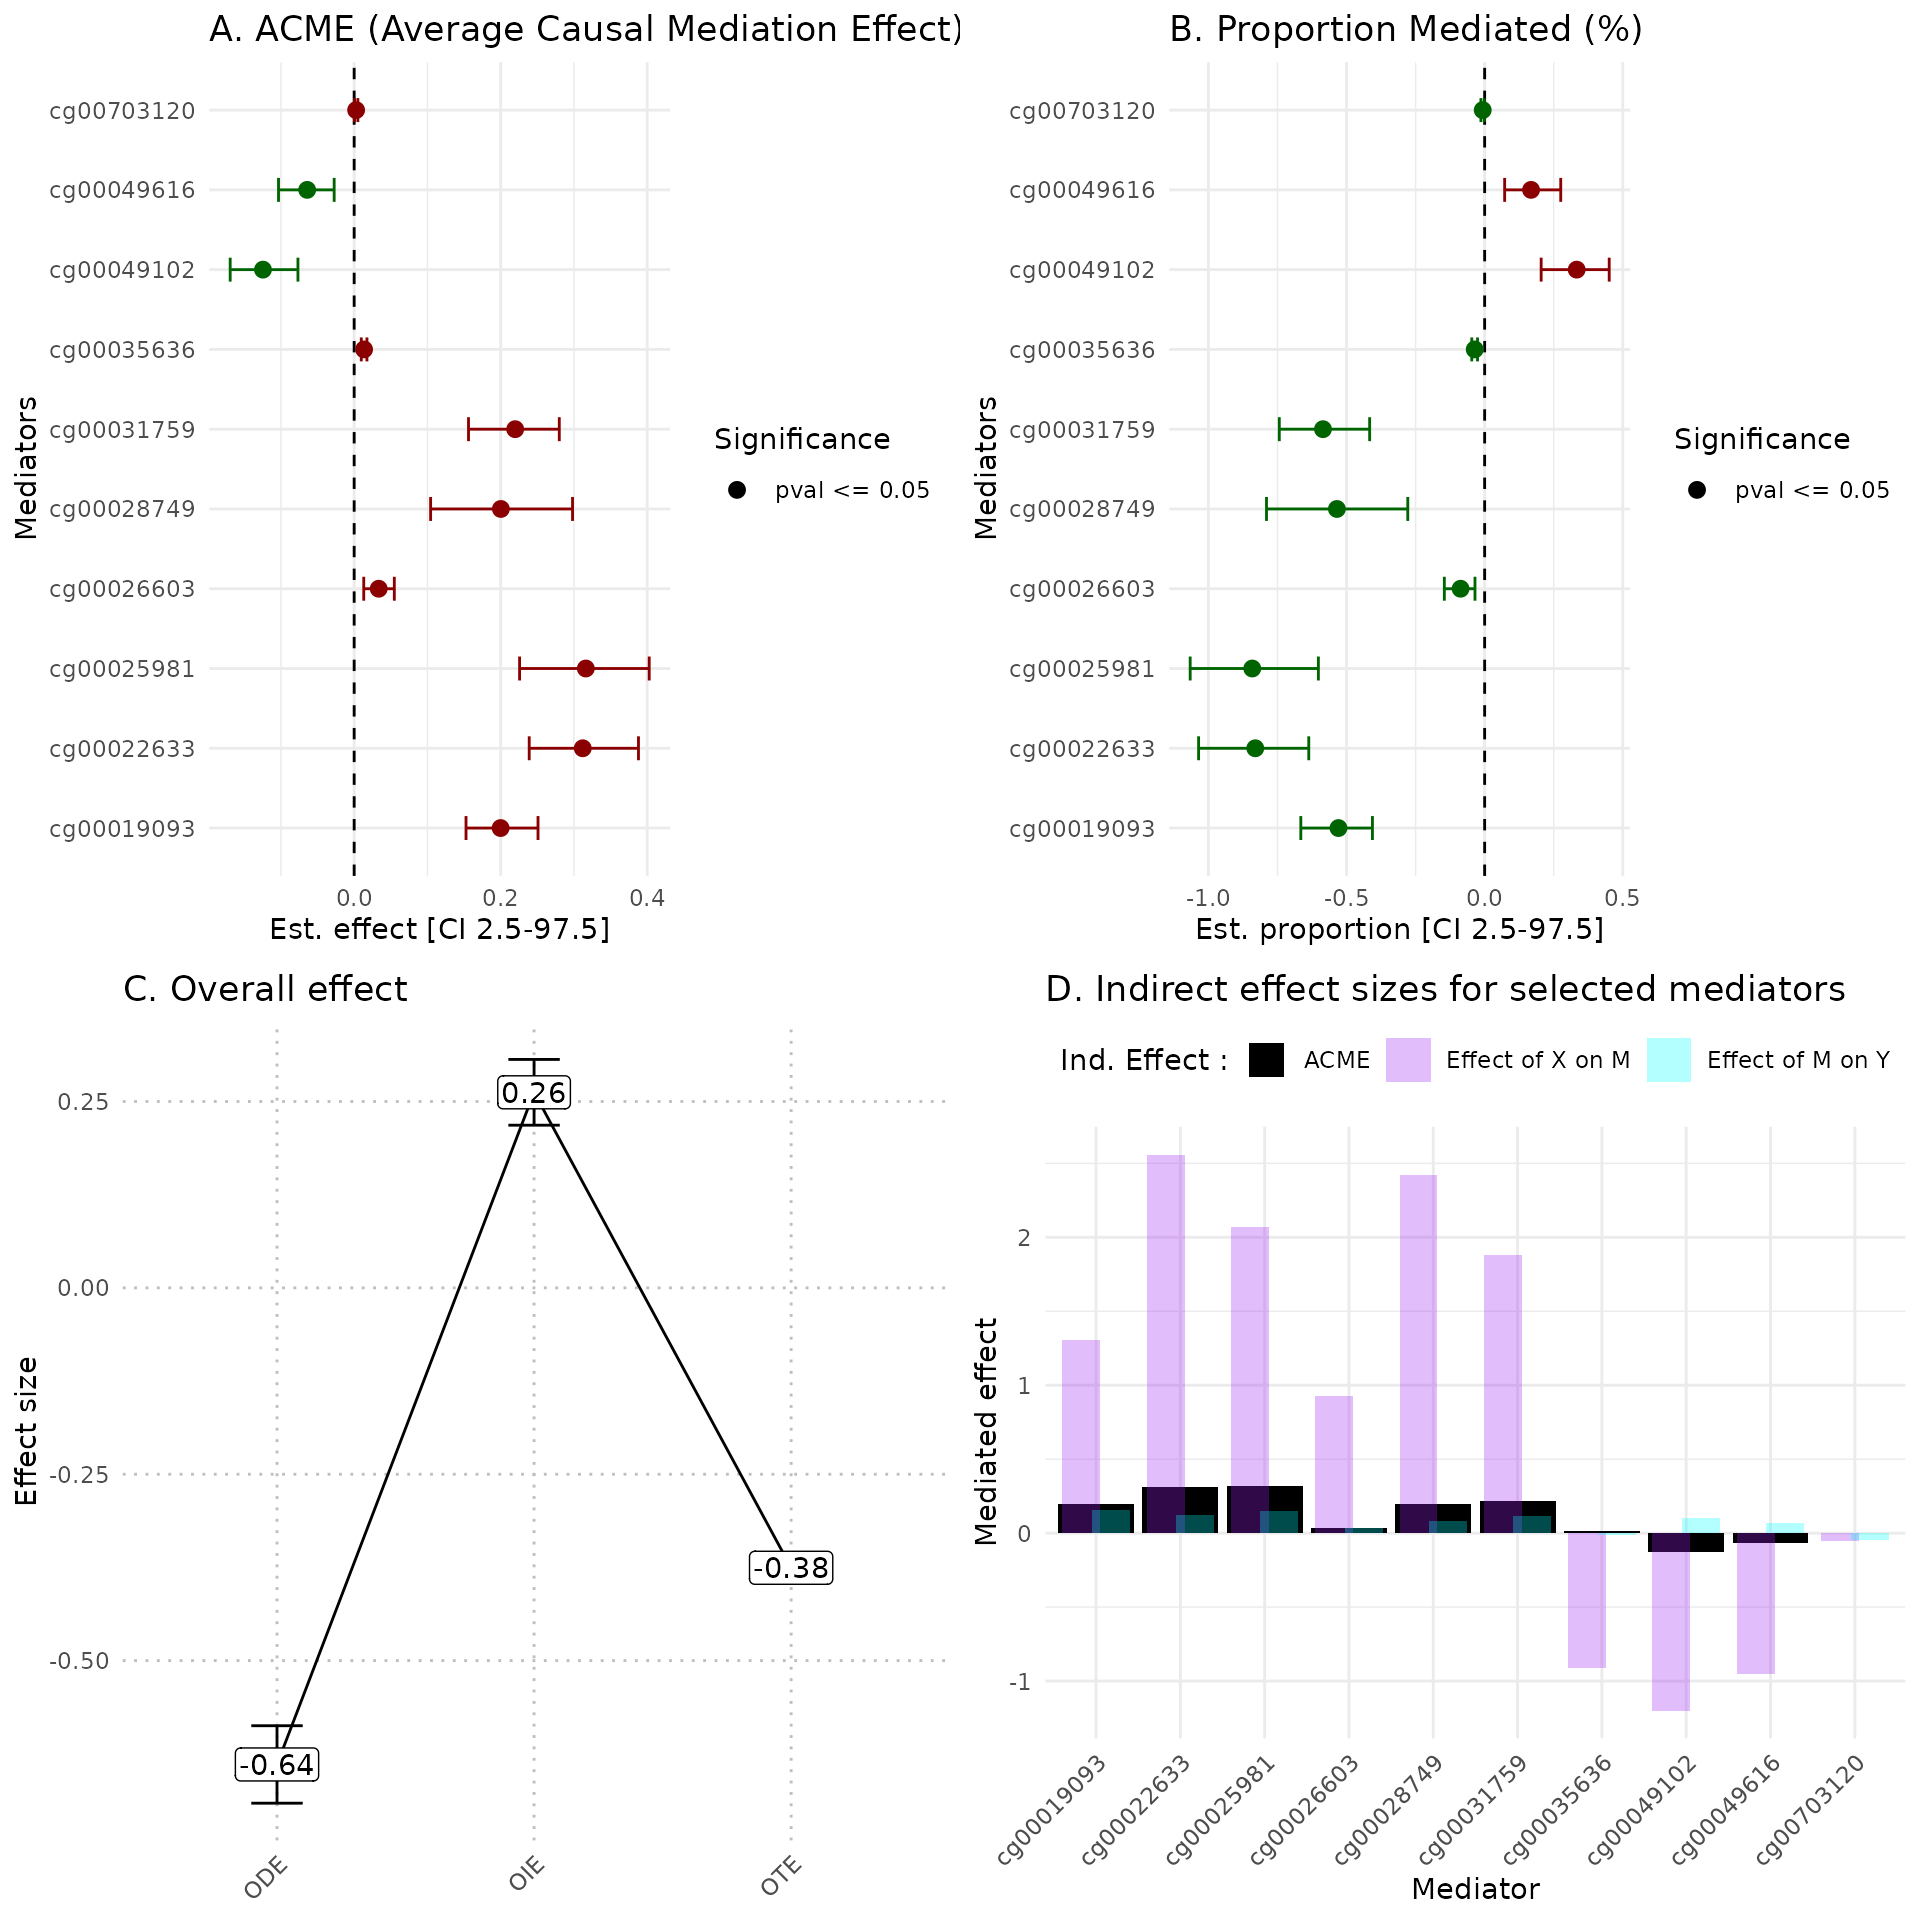
#> TableGrob (2 x 2) "arrange": 4 grobs
#>   z     cells    name           grob
#> 1 1 (1-1,1-1) arrange gtable[layout]
#> 2 2 (1-1,2-2) arrange gtable[layout]
#> 3 3 (2-2,1-1) arrange gtable[layout]
#> 4 4 (2-2,2-2) arrange gtable[layout]
A Estimates of indirect effect (ACME) and B proportions of mediated effect (PM) for the top 10 mediators. The effect estimate is represented by a dot and its 95% CI by the bar. Symbols correspond to the significance cut off of 5% (square for p-value \(\geq 0.05\), circle p-value \(< 0.05\)). Colors correspond to the sign of the effect (green for estimated effect \(\leq 0\) , red for estimated effect \(> 0\)).
C Effect sizes of Overall Direct Effect (ODE), Overall Indirect Effect (OIE) and Overall Total Effect (OTE). Error bars correspond to standard deviation (ODE and OTE) or confidence interval (OIE).
D Indirect effect sizes for the selected mediators. Black corresponds to the ACME, violet to the effect of exposure \(X\) on mediator \(M\), and blue corresponds to the effect of mediator \(M\) on outcome \(Y\).
In the plot_hdmax2 function it is possible to produce
the 4-plots set or each individual plot with plot_type
argument.