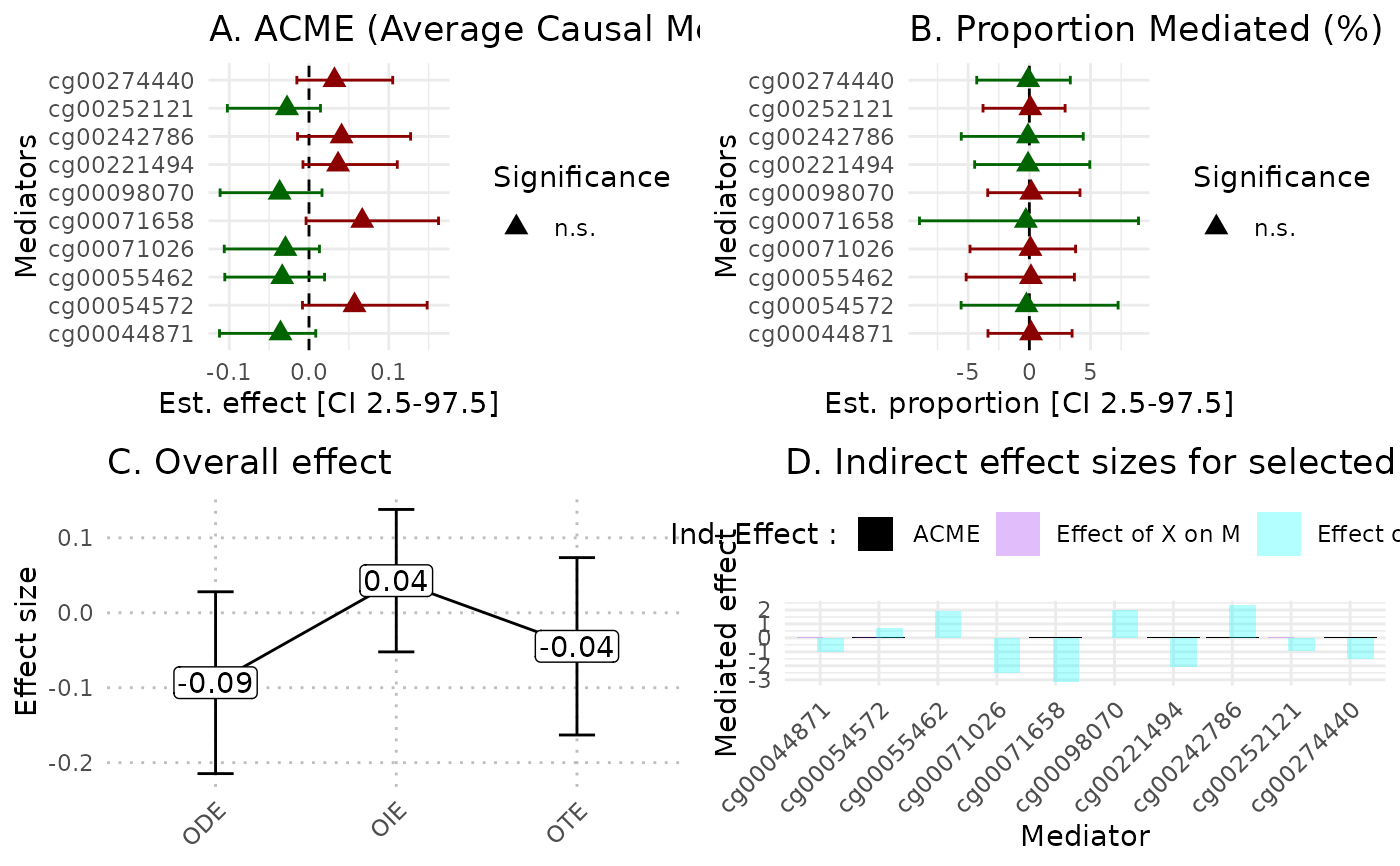
Summary plot for HDMAX2
plot_hdmax2.RdThis function draw a summary plot of hdmax2 method results
Examples
# Load example dataset
simu_data = hdmax2::simu_data
K = 5
# Run {hdmax2} step 1
hdmax2_step1 = hdmax2::run_AS(
  exposure = simu_data$X_continuous ,
  outcome =  simu_data$Y_continuous,
  M =  simu_data$M,
  K = K
)
#> Running first regression with univariate exposure variable.
#> Running second regression.
#> Running max-squared test.
# Select mediators
mediators_subset = names(sort(hdmax2_step1$max2_pvalues)[1:10])
mediators_top10 = simu_data$M[, mediators_subset]
# Run {hdmax2} step 2
hdmax2_step2 = hdmax2::estimate_effect(object = hdmax2_step1,
                                       m = mediators_top10)
#> Estimating indirect effect for univariate exposome.
#> The input exposome is continuous or binary
#> Generate regression 1 for continuous or binary exposure and mediator 1
#> Generate regression 2 for continuous outcome and mediator 1
#> Generate regression 1 for continuous or binary exposure and mediator 2
#> Generate regression 2 for continuous outcome and mediator 2
#> Generate regression 1 for continuous or binary exposure and mediator 3
#> Generate regression 2 for continuous outcome and mediator 3
#> Generate regression 1 for continuous or binary exposure and mediator 4
#> Generate regression 2 for continuous outcome and mediator 4
#> Generate regression 1 for continuous or binary exposure and mediator 5
#> Generate regression 2 for continuous outcome and mediator 5
#> Generate regression 1 for continuous or binary exposure and mediator 6
#> Generate regression 2 for continuous outcome and mediator 6
#> Generate regression 1 for continuous or binary exposure and mediator 7
#> Generate regression 2 for continuous outcome and mediator 7
#> Generate regression 1 for continuous or binary exposure and mediator 8
#> Generate regression 2 for continuous outcome and mediator 8
#> Generate regression 1 for continuous or binary exposure and mediator 9
#> Generate regression 2 for continuous outcome and mediator 9
#> Generate regression 1 for continuous or binary exposure and mediator 10
#> Generate regression 2 for continuous outcome and mediator 10
#> Computing ODE and OTE for continuous outcome.
# Generate plot
hdmax2::plot_hdmax2(hdmax2_step2, plot_type = "all_plot")
#> [1] "hdmax2 plot for univariate exposome"

#> TableGrob (2 x 2) "arrange": 4 grobs
#>   z     cells    name           grob
#> 1 1 (1-1,1-1) arrange gtable[layout]
#> 2 2 (1-1,2-2) arrange gtable[layout]
#> 3 3 (2-2,1-1) arrange gtable[layout]
#> 4 4 (2-2,2-2) arrange gtable[layout]