Cross validation of LFMM estimates with ridge penalty
This function splits the data set into a train set and a test set, and returns
a prediction error. The function lfmm_ridge is run with the
train set and the prediction error is evaluated from the test set.
lfmm_ridge_CV(Y, X, n.fold.row, n.fold.col, lambdas, Ks)
Arguments
| Y | a response variable matrix with n rows and p columns. Each column corresponds to a distinct response variable (e.g., SNP genotype, gene expression level, beta-normalized methylation profile, etc). Response variables must be encoded as numeric. |
|---|---|
| X | an explanatory variable matrix with n rows and d columns. Each column corresponds to a distinct explanatory variable (eg. phenotype). Explanatory variables must be encoded as numeric. |
| n.fold.row | number of cross-validation folds along rows. |
| lambdas | a list of numeric values for the regularization parameter. |
| Ks | a list of integer for the number of latent factors in the regression model. |
| p.fold.col | number of cross-validation folds along columns. |
Value
a dataframe containing prediction errors for all values of lambda and K
Details
The response variable matrix Y and the explanatory variable are centered.
See also
Examples
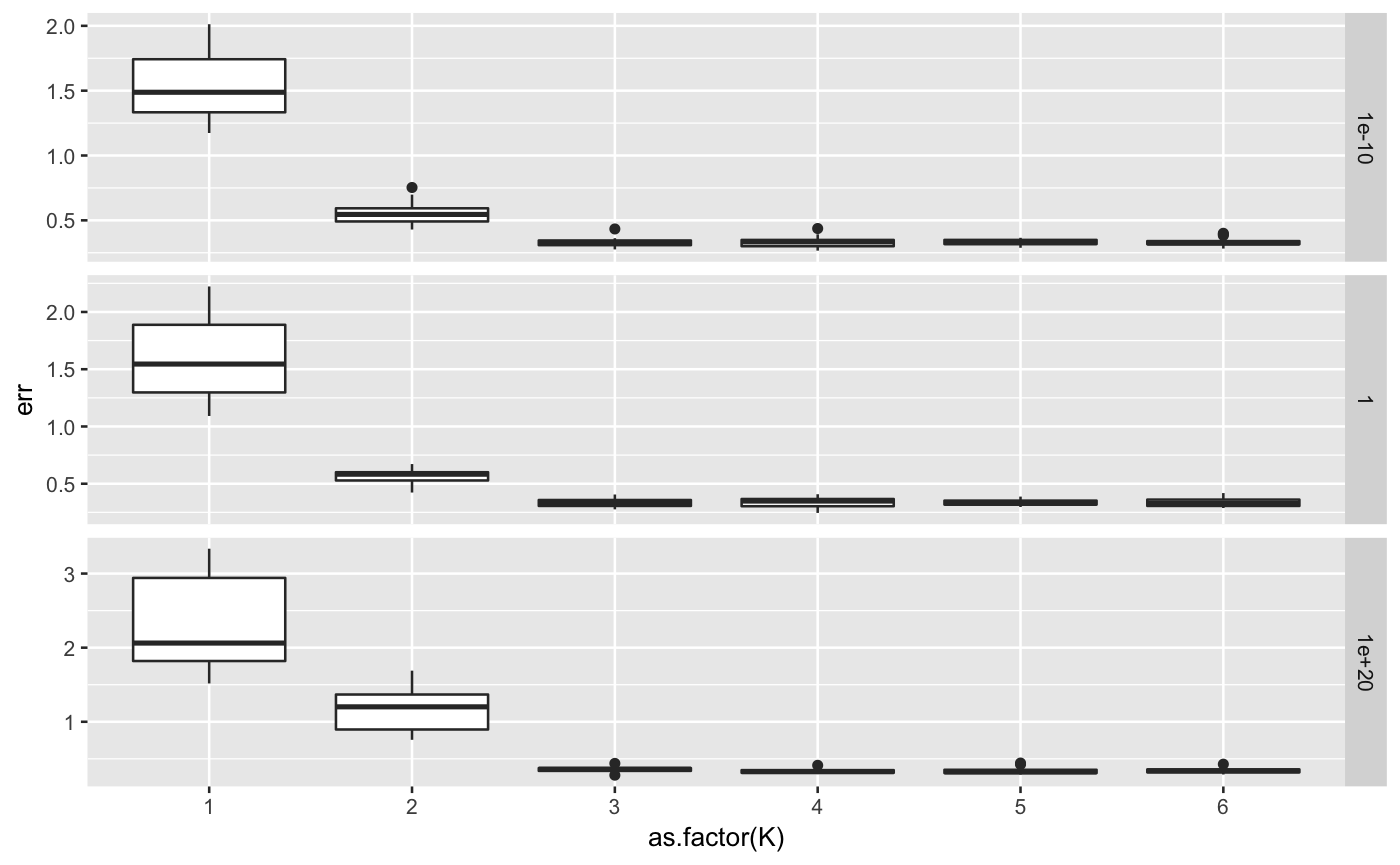
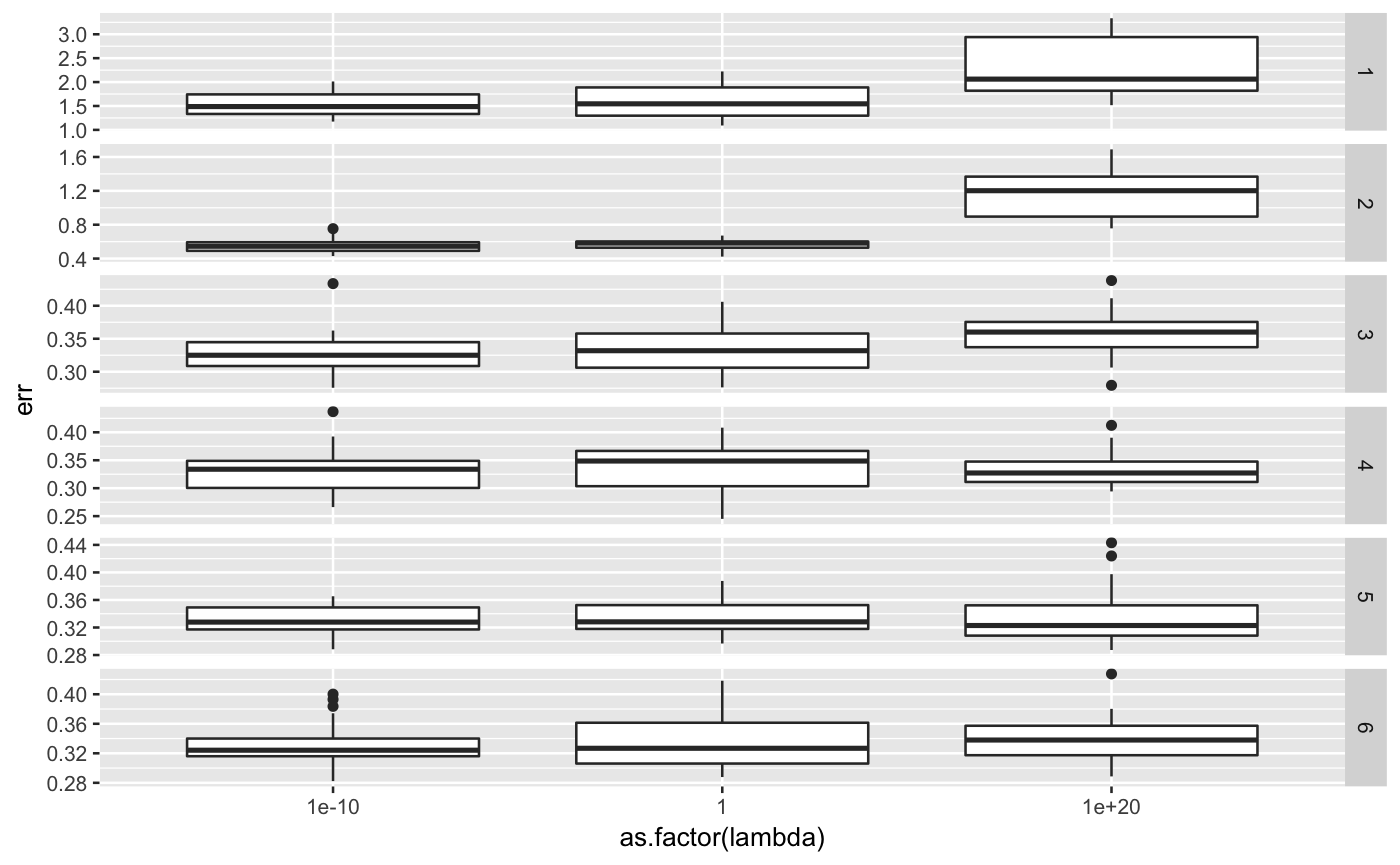
library(ggplot2) library(lfmm) ## sample data K <- 3 dat <- lfmm_sampler(n = 100, p = 1000, K = K, outlier.prop = 0.1, cs = c(0.8), sigma = 0.2, B.sd = 1.0, U.sd = 1.0, V.sd = 1.0)#>## run cross validation errs <- lfmm_ridge_CV(Y = dat$Y, X = dat$X, n.fold.row = 5, n.fold.col = 5, lambdas = c(1e-10, 1, 1e20), Ks = c(1,2,3,4,5,6))#> Warning: executing %dopar% sequentially: no parallel backend registered#>#> lambda K #> 1 1e-10 1#>#> lambda K #> 2 1 1#>#> lambda K #> 3 1e+20 1#>#> lambda K #> 4 1e-10 2#>#> lambda K #> 5 1 2#>#> lambda K #> 6 1e+20 2#>#> lambda K #> 7 1e-10 3#>#> lambda K #> 8 1 3#>#> lambda K #> 9 1e+20 3#>#> lambda K #> 10 1e-10 4#>#> lambda K #> 11 1 4#>#> lambda K #> 12 1e+20 4#>#> lambda K #> 13 1e-10 5#>#> lambda K #> 14 1 5#>#> lambda K #> 15 1e+20 5#>#> lambda K #> 16 1e-10 6#>#> lambda K #> 17 1 6#>#> lambda K #> 18 1e+20 6## plot error ggplot(errs, aes(y = err, x = as.factor(K))) + geom_boxplot() + facet_grid(lambda ~ ., scale = "free")ggplot(errs, aes(y = err, x = as.factor(lambda))) + geom_boxplot() + facet_grid(K ~ ., scales = "free")

